Create an irregular figure by combining the pieces of wood joined by Velcro and place it in the center of the red square that has a side equal to 1 m and therefore an area equal to 1 m^2. How can you calculate the area of the irregular figure you created?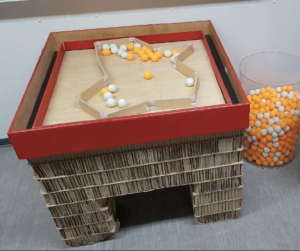
Here’s a possible solution: imagine that you dropped an even rain of ping-pong balls inside the red square: if you counted the balls and found that half of them fell inside your figure constructed from the sticks, what could you deduce about its area? That it is about half that of the square.
What if the balls dropped inside the constructed figure were one-third of the total? You would think that the area of the figure is about one-third of 1 m^2.
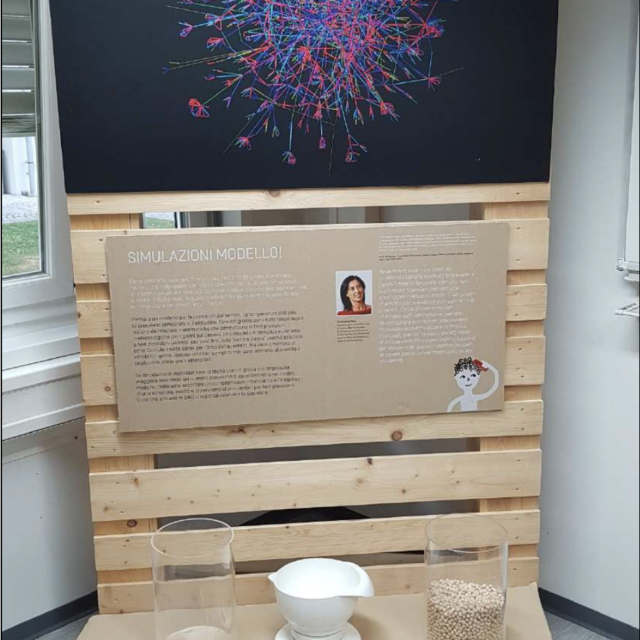
This is a method that gives an estimate of area not an exact value. If I want to increase the accuracy of my estimate, I can use smaller objects, for example, chickpeas or sand instead of ping-pong balls. Of course instead of counting chickpeas or grains of sand the can be weighed.
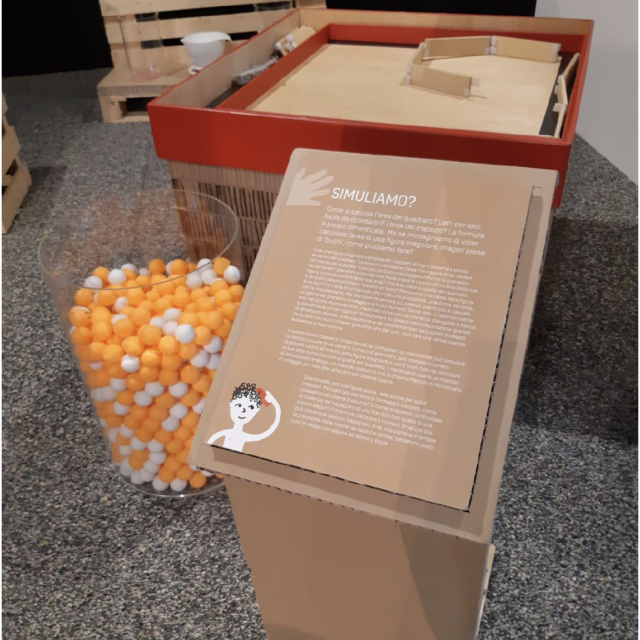
We understand the importance of computers: a suitably programmed computer can simulate the random fall of a large number of chickpeas, it can count the number of chickpeas that fell inside the irregular figure and those outside, so as to estimate the area of a generic figure as an appropriate fraction of that of the outer square, which, we recall, is equal to 1 m2.
So far we have reasoned with plane figures, but the reasoning can be extended to irregular solids as well. Think of a slice of cheese with holes in it, how can we calculate its volume? Or how can we compare the trunk capacity of a subcompact car with that of a station wagon? We could calculate the number of suitcases each trunk can hold (the suitcases play the role of ping-pong balls here), and if we wanted to increase the accuracy of our assessment (estimation) we could replace the suitcases with tennis balls… now don’t think about filling the trunk of your parents’ car with chickpeas or, even worse, sand, to estimate its capacity – they wouldn’t be very happy!
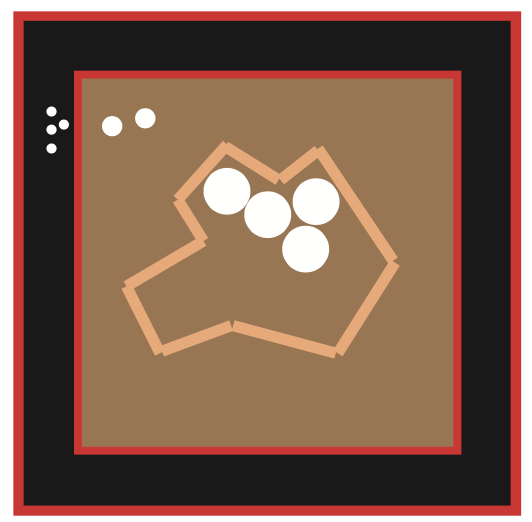
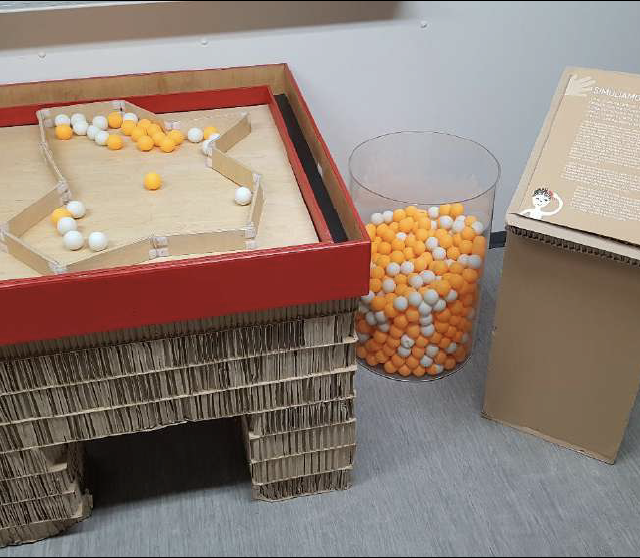
Strategy: You fill the red square (and consequently also the area bounded by the sticks) with a layer of balls. We count the balls (we weigh the chickpeas or sand if we want more precise estimates) inside that red square (including those inside the figure). We denote this value by X. We then count only the balls inside the figure bounded with the little sticks. We denote this value by Y. A simple proportion will lead to an estimate of the area.
For example, let’s imagine that we fit exactly 100 balls in the square. And let’s imagine that the little woods delimit exactly ¼ of the area inside the square. Inside the perimeter of the little woods will then fit about 25 balls. The corresponding area, denoted by A, is then obtained by solving the proportion:
25 : 100 = A : 1m2
A = 25/100 x 1 m2= 0.25 m2
 Click on the pic to download